
The Morning Intel | Tahoe Sector Watch
Location: #HippieHaus | South Lake Tahoe, CA
Date: February 9, 2026
¡Buenos días, my friends!
Cup’O’Joe in hand, #StokelevelzSolid on a #MindfulMonday morning. Back at the #HippieHaus offices after three amazing days of #TahoeFreeride up at Palisades. Yesterday’s event was WOW, just WOW…
Ok, straight to it, had to grab a few extra winks this AM, and then yep, prime and stimulate the bean with a little weather download. SNOW, SNOW, and SNOW is in the forecast, but with a few caveat inserts, a downgrade, a stall, and a “BUST” scenario for the mid-week wave.
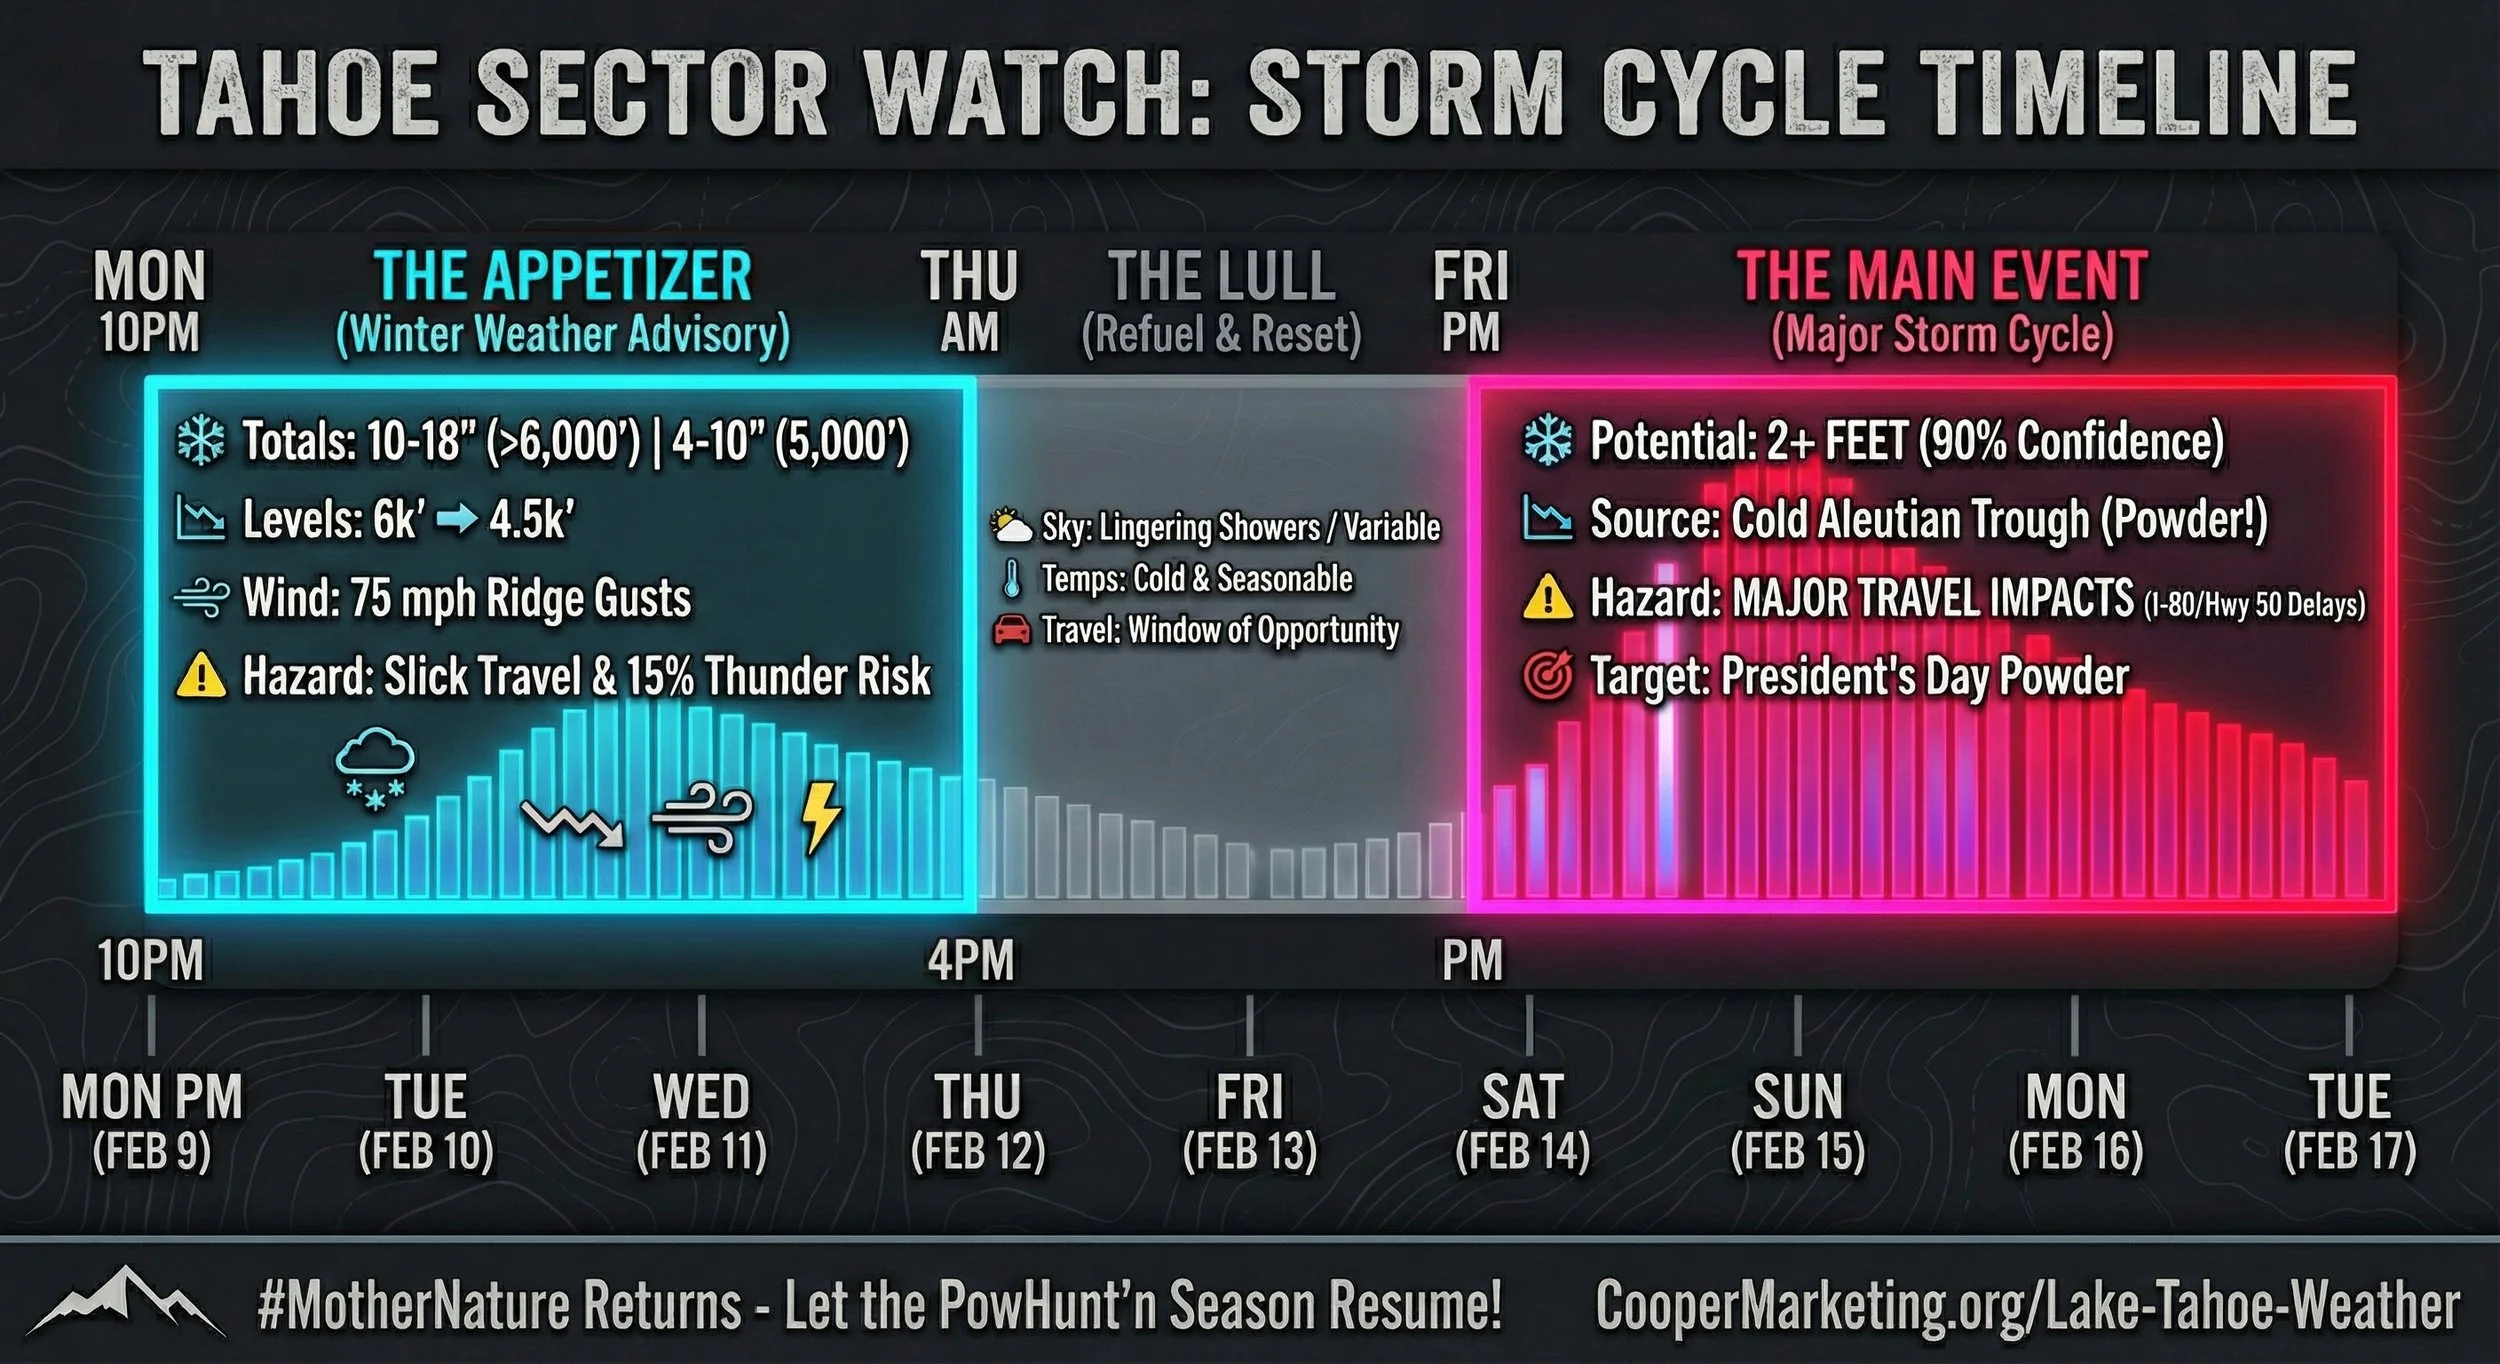
NWS teams in SAC and RNO align on the slowdown. The system has trended slower, pushing the heaviest snow into the Tuesday afternoon through Wednesday window. A Winter Weather Advisory is locked in from 10 pm Monday through 4 pm Wednesday. Snow levels are the tricky part—starting around 5,000-6,000 feet early Tuesday, then dropping to 4,500 feet Wednesday.
Now, I know I have been a lil-kurt on the Nay-sayers, Tommies, and Nancy’s. However, being stuck on lifts with the negativity is painful. “Why don’t they give us a ‘refund’? Passes are so expensive, and there is no fresh snow.” My response: Simply don’t buy a pass, and give up the sport. No one ever guaranteed a bell-to-bell #ColdSmokeWinter; sometimes we have to practice patience and enjoy every day on the Mountain we have. #NeverWasteADay
“If a problem is fixable, if a situation is such that you can do something about it, then there is no need to worry. If it’s not fixable, then there is no help in worrying. There is no benefit in worrying whatsoever.”
— Dalai Lama XIV
🌡️ Regional Pulse (Current Conditions as of 0516)
South Lake Tahoe (KTLV): 29ºF
Truckee (KTRK): 32ºF
Palisades (Siberia 8,700’): 23ºF
Alpine Meadows (Mt Ward 8,643’): 25ºF
KirkwoodMtn (Chair 6 9,100’): 26ºF
MammothMtn (Summit 11,034’): 28ºF
Current Regional Winds:
HippieHaus: E 7mph
Mid-Lake Buoy: ENE 7mph
Donner Pass: ENE 10mph
Alpine Meadows (Ward): N 18/21mph
Palisades (Siberia): E 20/26mph
Kirkwood (Chair 6): E 33/45mph
Mammoth (Summit): N 10/13mph
📡 The Morning Intel: AFD & OpenSnow Comparison
🔍 Comparison & Key Nuances:
NWS Reno (REV): Calls the Monday/Tuesday wave the “appetizer.” They forecast 3-6 inches at lake level and 12-18 inches on ridges by Wednesday. Crucial note: Ridge gusts will hit 75 mph Tuesday night into Wednesday, creating significant travel and lift ops issues.
NWS Sacramento (STO): Highlights the “slow-down.” The heaviest snow is now delayed until Tuesday afternoon/Wednesday. They forecast 4-10 inches above 5,000’ and 10-18 inches above 6,000’, with up to 2 feet on peaks. Thunderstorm risk (15-20%) for Tuesday afternoon adds a convective “wildcard.”
OpenSnow/B.A.: The outlier (and often the realist). B.A. has downgraded the mid-week forecast significantly, citing a trend where the front “lifts north” of Tahoe on Tuesday. He calls for only 0.6 - 1.2 inches of liquid near the crest (down from 2"+), translating to lower snow totals than the NWS.
Consensus: The mid-week storm is tricky. NWS is bullish on travel impacts; OpenSnow is cautious on totals. Both agree the Holiday Weekend Storm (Feb 14-17) is the main event.
⚠️ Weather Advisories
Tahoe/Sierra Sector: WINTER WEATHER ADVISORY in effect from 10 PM Monday to 4 PM PST Wednesday.
Mariners: WINTER WEATHER ADVISORY for Lake Tahoe from 10 PM tonight to 4 PM Wednesday. East winds 10 mph becoming light, but gusty on the ridges.
❄️ Sierra Avalanche Center Report
Status: LOW DANGER (#KnowBeforeYouGo)
Central Sierra: https://bit.ly/SierraAvyForecast
Issued: Feb 9 | Expires: Feb 10, 4:00 AM.
Author: Brandon Schwartz
THE BOTTOM LINE: Avalanches remain unlikely today. Isolated areas exist that hold very thin slabs of wind-drifted snow. If you see cracks or unexpected conditions, consider a different route.
Eastside Region: https://bit.ly/SierraAvyForecast
Issued: Feb 9 | Expires: Feb 10, 7:00 AM.
Author: Steve Mace
THE BOTTOM LINE: Danger remains low. Monitor for isolated areas of unstable snow in steep or exposed terrain.
✈️ Tahoe Aviation Section
Status: MVFR/IFR conditions developing.
Details: Light showers moving through this morning will bring mountain obscuration and LLWS. Ridge gusts of 45-50 kts forecast for Tuesday will create moderate to severe turbulence. Accumulating snow at KTRK/KTVL (1-2 inches) expected through Tuesday night.
⚓ Mariners & Lake Level Report
Lake Level (Tahoe City): 6,227.54 feet (Delta: +0.01 ft).
Water Temp: 43.9ºF (Delta: -0.1ºF).
Forecast: Mostly cloudy, slight chance of rain/snow. East winds 10 mph.
Advisory: WINTER WEATHER ADVISORY in effect tonight through Wednesday. Expect reduced visibility and choppy conditions.
🔭 The Weather Ahead: Detailed Outlook
Monday Night - Wednesday (The Appetizer): Snow levels fluctuate (5,000’ - 7,500’). Total snow: 4-10" (5,000’), 10-18" (6,000’). Travel impacts likely for Tuesday PM/Wednesday AM commute.
Thursday - Friday: A lull. Scattered showers linger, but high pressure briefly builds.
President’s Weekend (The Main Event): Confidence is 80-90% for a major storm cycle starting Saturday. This system is colder (Aleutian source) and wetter. NWS Reno forecasts a high chance for 2+ FEET of snow. OpenSnow sees potential for 5 inches of liquid (measured in feet of snow) through the holiday week.
Stay’nThirsty for POW
Coop
ECMWF AIFS AI [M] 0.25º 6-hr Precip (in.), MSLP (hPa), 850mb Temp.(ºC)
ECMWF AIFS AI [M] 0.25º 500mb Height (dam) and Anomaly - 5 day
ECMWF AIFS AI [M] 0.25º 96-hr Precipitation (Inches)
ECMWF AIFS AI [M] 0.25º 7 - Day Snow (10:1 ratio) (Inches)
ECMWF AIFS AI Ens 0.25º - Total Snow (10:1 Ratio) (Inches)
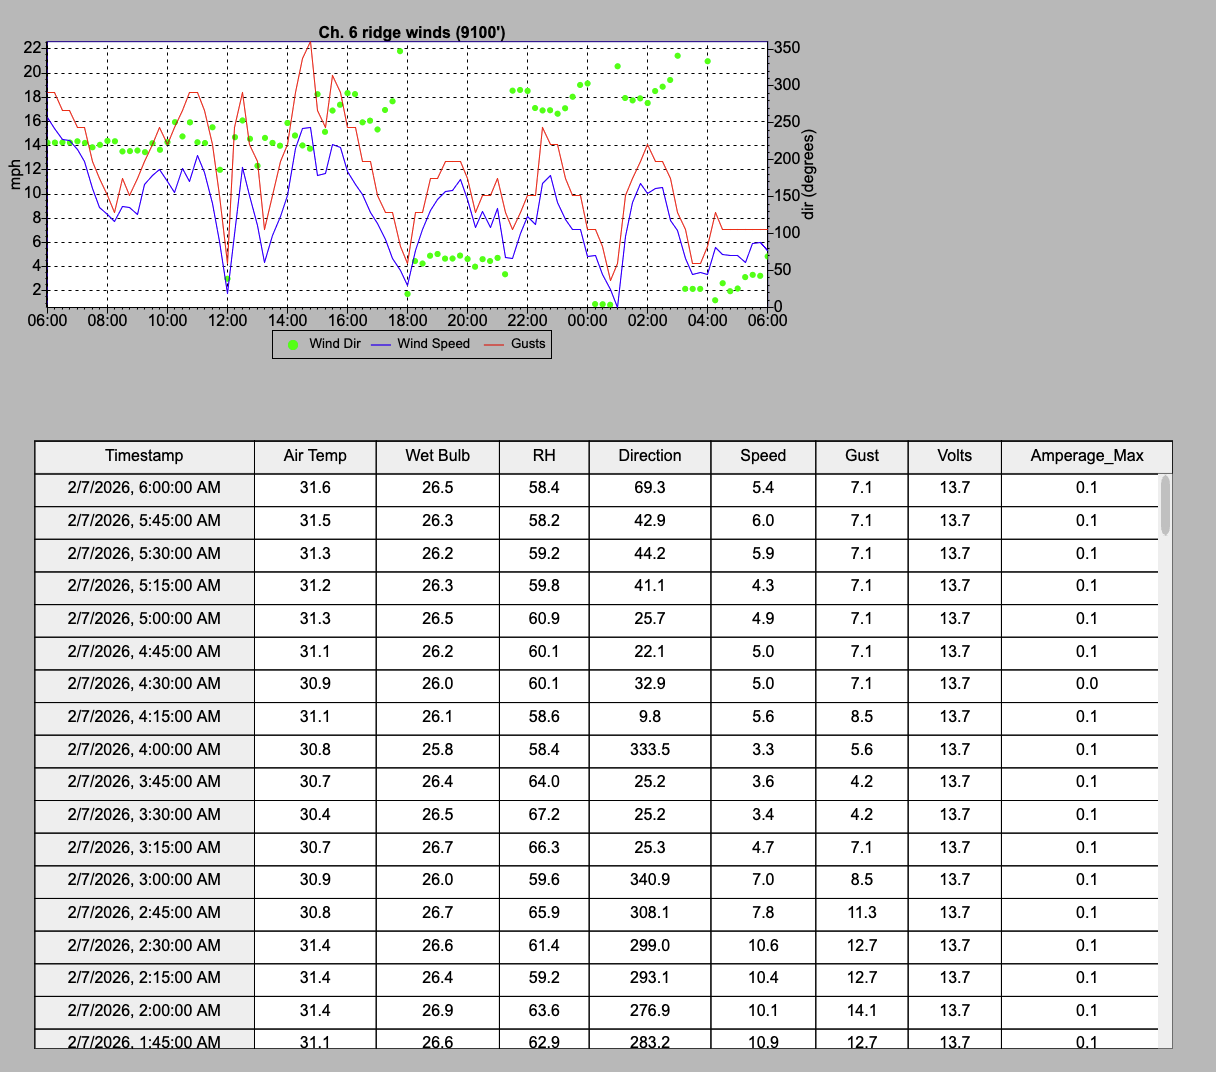
Chair Six(6) Ridge 2.7.26 - KirkwoodMtn - 9,100’
NAM 3Km 6hr Precip, MSLP, 850mb Temp (Cº)
NAM 3km Composite Reflectivity + Precip Type
NBM Para v5 2.5km 24-hr Snow (Inches)
NAM 3km | 24hr Snow (Kuchera Ratio) (Inches)
NAM 3km | 24hr Precipitation (in)
NAM 3km | 2m Temperatures - MIN ºf)
NAM 3km | 80m Wind Speeds + Streamlines (kts)
NAM 3km | 0-6km Wind Shear (kts) + Streamlines
NAM 3km | 925mb Wind (kts) + Streamlines
NAM 3km | 24-hr Snow (Inches) Utah
NAM 3km | 24-hr Snow (Inches) Colorado
NAM 3km | 24-hr Snow (Inches) WA
NAM 3km | 24hr Snow (10:1 Ratio) British Columbia
NAM 3km | 24hr Snow (10:1 Ratio) Idaho
NAM 3km | 24hr Snow (10:1 Ratio) Montana
NAM 3km | 24hr Snow (10:1 Ratio) Wyoming


